CFAST Visualizations
CFAST Visualization
Since CFAST is a traditional two-zone model assuming evident stratification of the hot gas layer and cold gas layer, and each layer is assumed to be uniform in temperature, vertical elevation, and chemical composition, the visualizations are restricted to zone temperatures and device temperatures. The device temperatures are attached to a raceway, plant equipment or physical object located in the compartment.
Zone Temperature Visualization
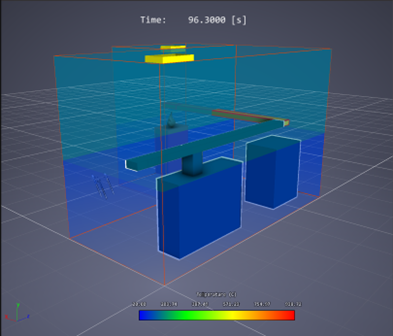
The following illustration depicts zone temperature visualization by the CFAST output from FRI3D. It reads the various csv files output by CFAST to color code the zone temperatures
Zone Temp Slices
Failures Visualization
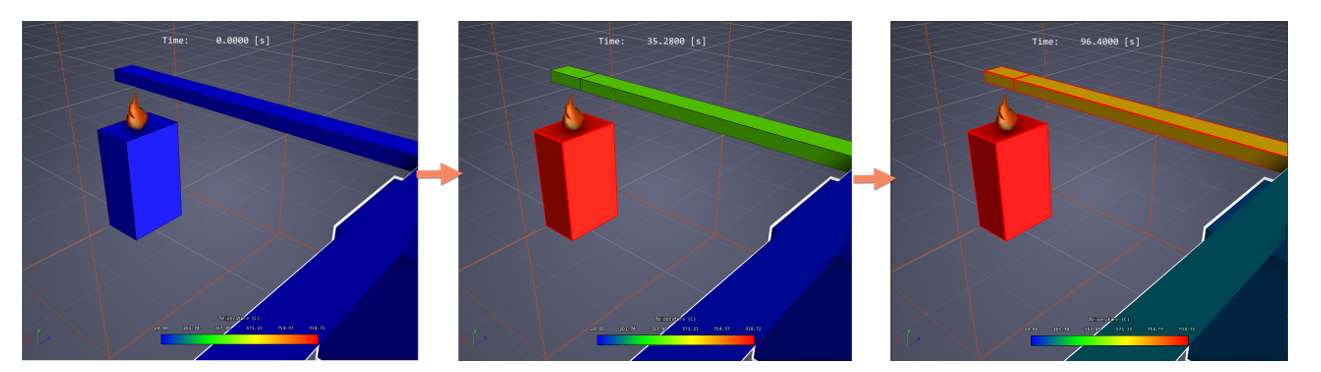
The failures are outlined in red when it occurs in the timeline. The failure timeline is indicated with markers at the appropriate failure times as indicated by the following images.
Progression of Failure
Timeline of Failures
