FDS Visualization
FDS Visualization
Zone Temperature Visualization
Zone Temp Volume
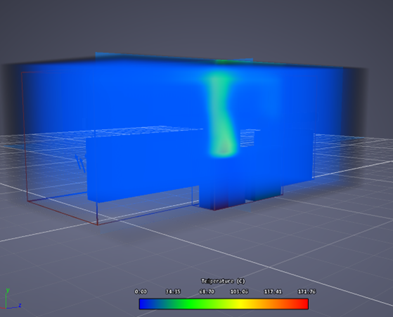
Zone Temp Slices
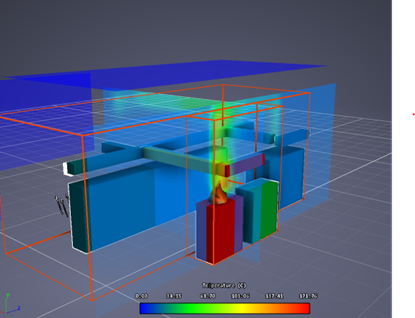
Failures Visualization
The failures as indicated by temperature probes placed measuring WALL_TEMPERATURES on the surface of the obstacles at a plane closest to the fire source simulated are visualized by FRI3D with a RED outline.
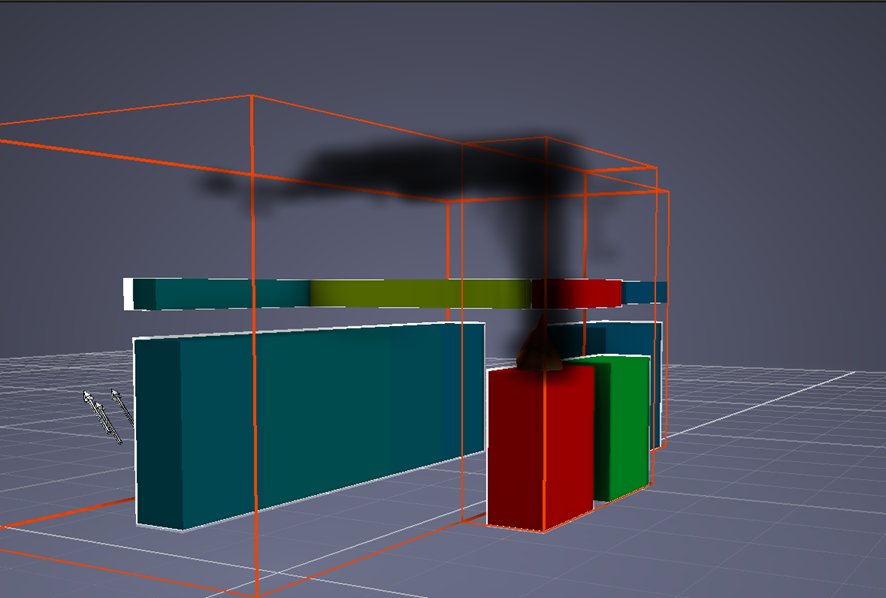
Smoke Visualization
FDS outputs smoke quantities like the amount of soot, temperature, and heat flux into a file with .s3d extension. This file format is documented in the Fire Dynamics Simulator User’s Guide. FDS output is generated by specifying the directive to output *.s3d.sz files—this text file contains the time specification of quantities in a run length encoded compressed format.
Smoke 3D Vis
Failures Visualization
The failures are outlined in red when it occurs in the timeline. The failure timeline is indicated with markers at the appropriate failure times as indicated by the following images.
Progression of Failure
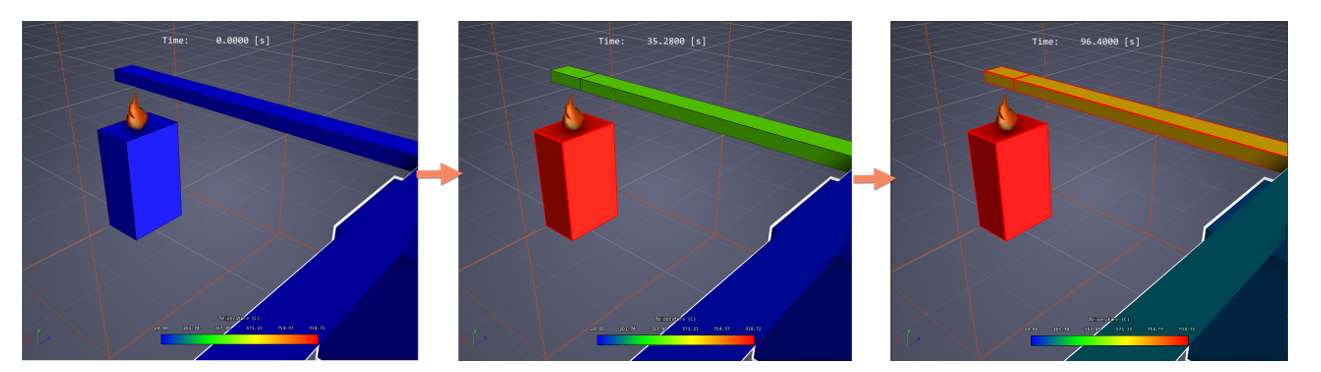
Timeline of Failures
