FDS可視化
FDSの可視化
ゾーン温度の可視化
Zone Temp Volume
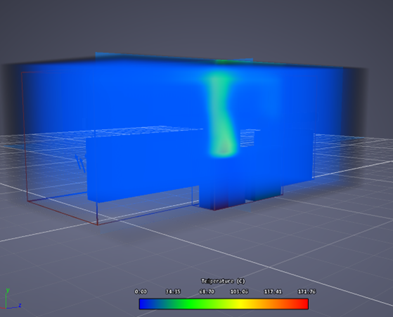
Zone Temp Slices
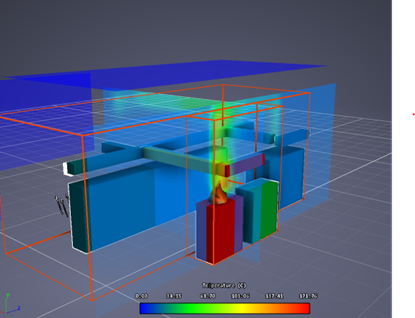
故障の可視化
シミュレーションされた火源に最も近い平面上で、障害物(オブスタクル)表面のWALL_TEMPERATURESを計測する温度プローブによって示された故障(損傷)は、FRI3Dでは赤色の輪郭線で可視化されます。
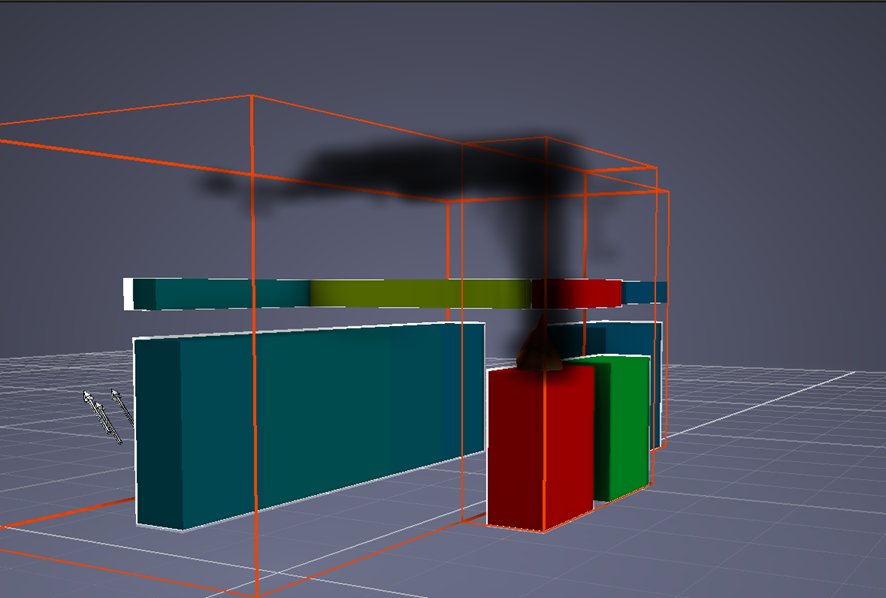
煙の可視化
FDSは、すす(スート)量、温度、熱流束などの煙に関する物理量を、拡張子.s3dのファイルに出力します。 このファイル形式は、Fire Dynamics Simulator User's Guide に記載されています。 FDSの出力は、*.s3d.sz ファイルを出力するディレクティブを指定することで生成されます。このテキストファイルには、ランレングス符号化で圧縮された形式で各物理量の時刻情報が格納されています。
Smoke 3D Vis
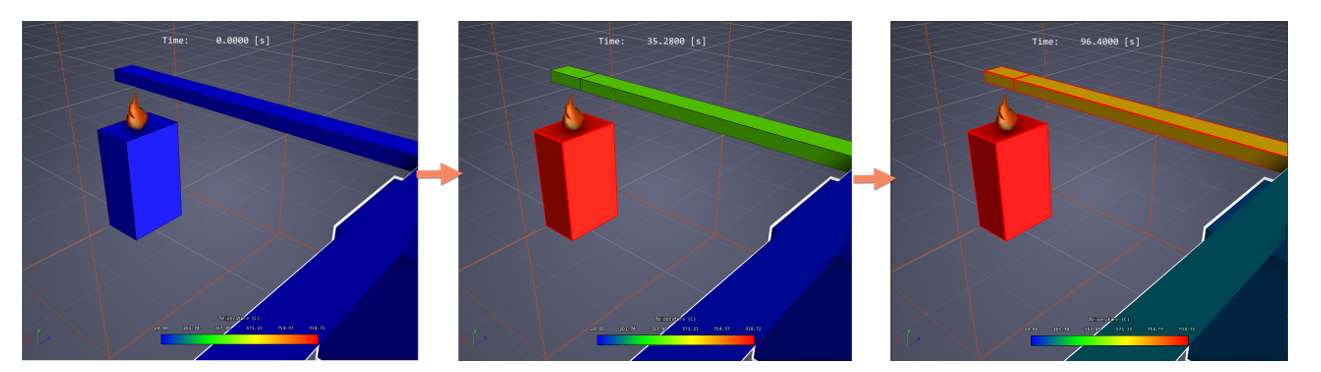
故障の可視化
故障(損傷)は、タイムライン上で発生した時点で赤色の輪郭線で表示されます。故障タイムラインには、以下の画像に示すように、それぞれの故障発生時刻にマーカーが表示されます。
Progression of Failure
Timeline of Failures
