CFAST Validation (NUREG 1934 Appendix B)
CFAST Validation (NUREG 1934 Appendix B)
This case extends the Appendix A MCR validation to a scenario with fire growth and spread: the U.S. NRC NUREG-1934 (EPRI 1023259), Appendix B — Cabinet Fire in a Switchgear Room. Where Appendix A validates deck replication of a fully prescribed fire, Appendix B additionally validates FRI3D's fire-spread modeling: the NRC model prescribes the secondary cable-tray fire as a hand-built HRR table derived offline with the FLASH-CAT method (NUREG/CR-7010), while FRI3D computes that secondary fire online — when the trays ignite, from the cabinet fire's CFAST-predicted flame height, and how much they burn, from the FLASH-CAT methodology — from nothing but the plant model geometry and the cable library. The published NRC CFAST model is run unmodified as the baseline, the FRI3D-generated deck for the same room is run with the same CFAST 7.7.3 build, and the two are compared over the full 3600 s simulation.
At a glance
| Quantity | NRC | FRI3D | Difference |
|---|---|---|---|
| Tray ignition (computed vs prescribed) | 480 s | 482 s | +2 s |
| Peak heat release rate | 1599 kW | 1595 kW | −0.2 % |
| Peak upper layer temperature rise | 83.6 °C | 83.4 °C | −0.3 % |
| Minimum layer height | 3.00 m | 3.02 m | +0.02 m |
| Minimum upper layer O₂ | 16.45 % | 16.44 % | −0.01 pt |
| Peak compartment pressure | 248.9 Pa | 249.3 Pa | +0.2 % |
| Tray target peak temperatures (3.9 / 4.4 / 4.9 m) | 808 / 1000 / 999 °C | 784 / 957 / 915 °C | −3 to −9 % |
Every compartment quantity follows the NRC baseline within 1 %. The tray target peaks are a few percent lower because the two decks use different kinds of target, explained under Cable-tray targets.
Reference case
A 464 kW electrical cabinet fire (PE/PVC fuel, C₂H₃.₅Cl₀.₅, heat of combustion 20.9 MJ/kg, radiative fraction 0.49, CO yield 0.147, soot yield 0.136) in a 26.5 × 18.5 × 6.1 m switchgear room, igniting a stack of three horizontal cable trays above the cabinet. Ventilation is three supply and three return fans (0.472 m³/s each, pressure cutoffs 200–300 Pa), and the room is otherwise sealed — the reference model defines a door-undercut vent but holds it closed for the whole run, so the compartment pressurizes to ≈ +250 Pa. Simulation duration 3600 s.
Input deck comparison
Every input group of the FRI3D-generated deck was compared field-by-field against the NRC model: ambient conditions, compartment geometry, leakage, mechanical ventilation, fire chemistry and yields, and the ignition-source HRR curve. All prescribed inputs match, including fan flow and the sealed-compartment configuration (both decks report a leakage area of 0.0 m²).
The remaining differences are not inputs. They are what FRI3D computes where the NRC model was given a hand-derived answer, which is the substance of this case:
- Secondary fire. Both decks carry the tray stack as a second fire alongside the cabinet, with its base at 3.8 m just below the lowest tray. NRC prescribes its ignition time and HRR table. FRI3D computes both, from the generic FLASH-CAT library defaults for the tray fuel loading, not values tuned to this scenario.
- Target representation. FRI3D targets are thin gas-exposure probes because cable failure (THIEF) is evaluated outside CFAST; NRC embeds THIEF cable cylinders in-deck. The two measure different things, so tray surface temperatures are indicative rather than like-for-like.
Results
Heat release rate
Heat release rate — FRI3D computed vs NRC prescribed
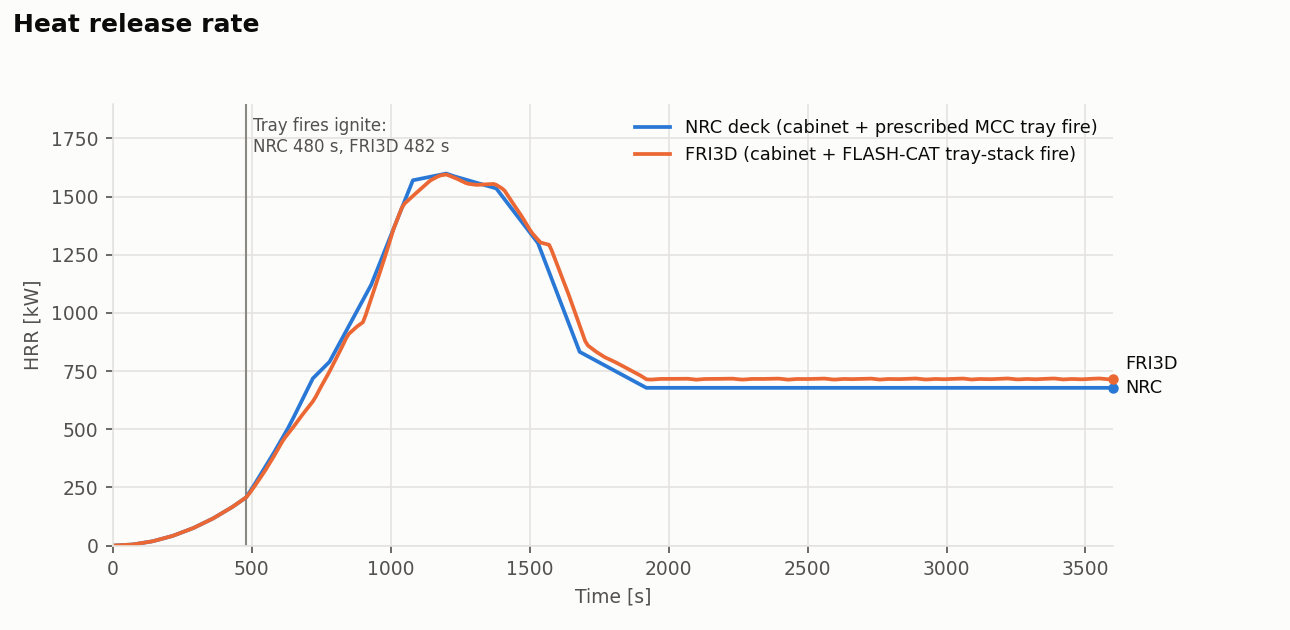
The heat release rate is the strongest statement in this case. FRI3D's tray ignition at 482 s, its peak of 1595 kW and its post-burnout tail of 717 kW are computed from the plant model and generic library cable data, against NRC's offline-derived 480 s, 1599 kW and 678 kW: the methodology reproducing the reference, not a copied input. The cabinet fire is identical in both decks, so the curves coincide until the trays ignite.
Cable-tray fire — FRI3D FLASH-CAT vs NRC prescribed
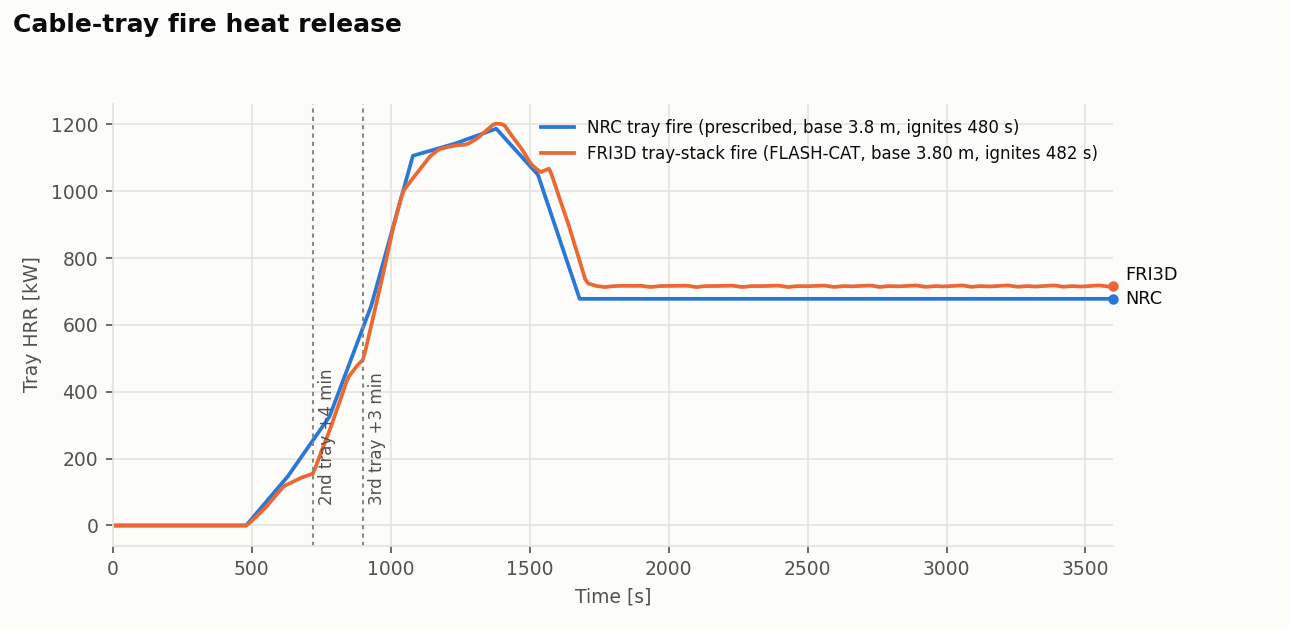
The tray fire on its own: FRI3D's second and third trays join 4 and 3 minutes after the first, following FLASH-CAT's timing sequence, and the stack burns out about 100 s later than NRC's table.
Upper layer temperature
Hot gas layer temperature
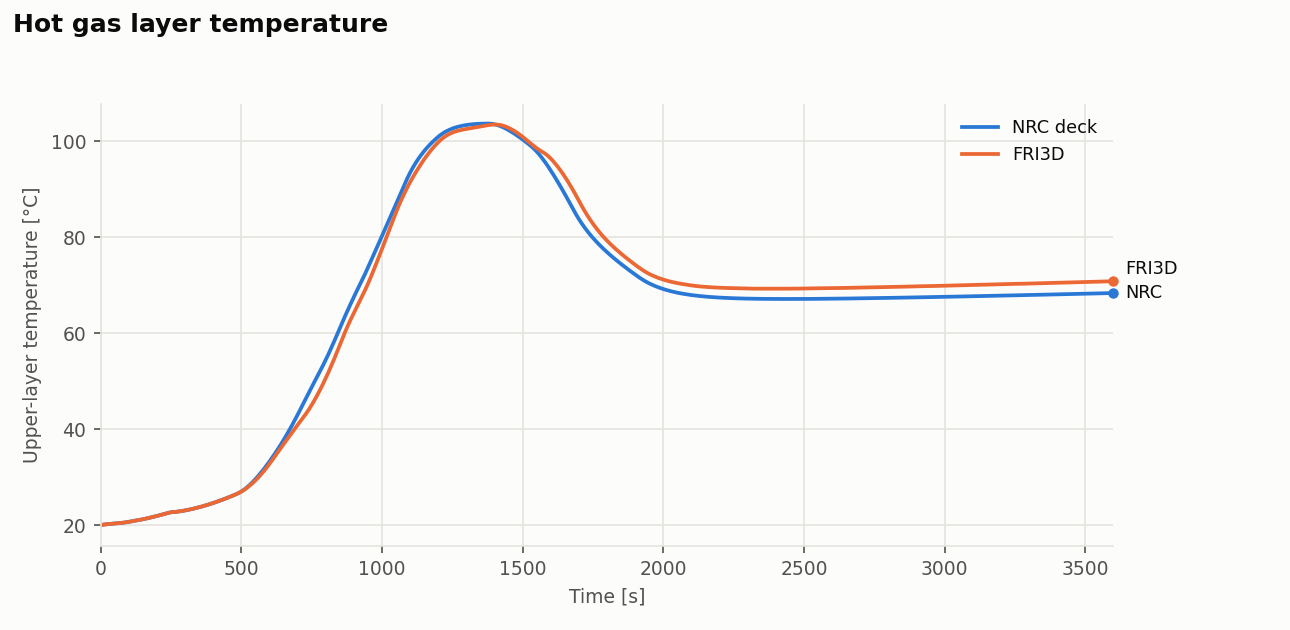
Peak upper layer temperature is 103.4 °C against NRC's 103.6 °C, and the two never differ by more than 4 °C. FRI3D runs about 2 °C warmer in the tail, following its slightly higher tray-fire tail.
Layer height and oxygen
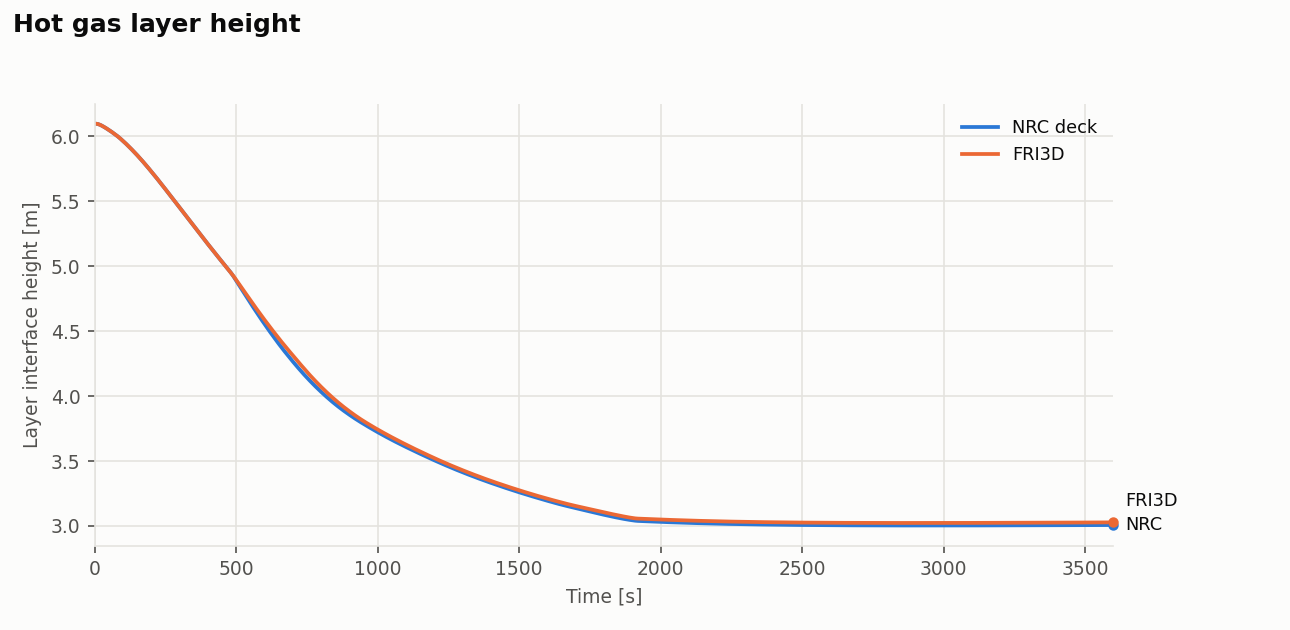
Hot gas layer height
Upper layer oxygen
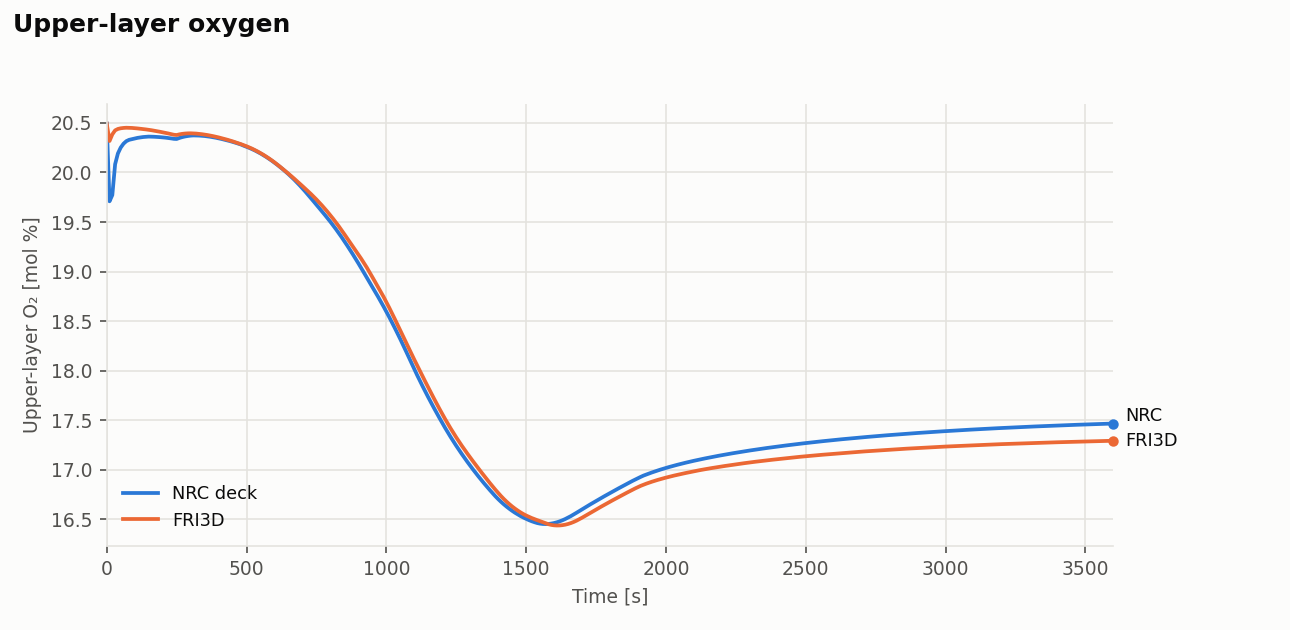
The layer descends together in both decks to a minimum of 3.02 m against 3.00 m, and upper layer oxygen dips to 16.4 % in both.
Pressure
Compartment pressure
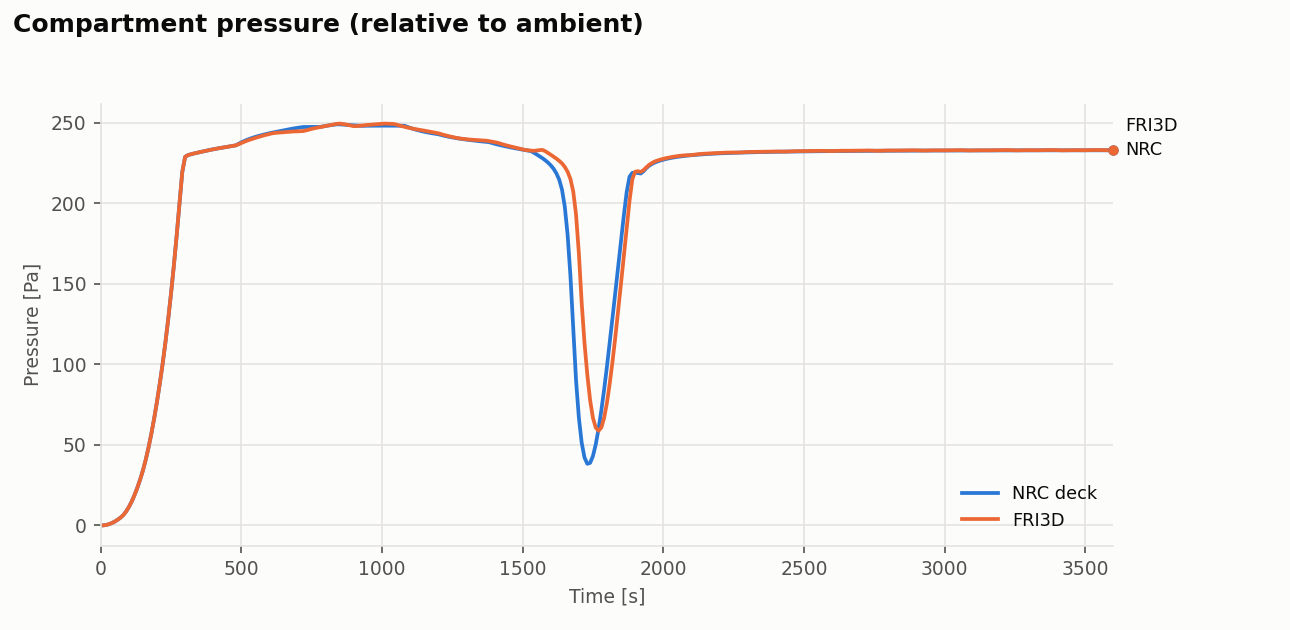
The sealed room pressurizes identically: both decks pass 200 Pa at 290 s and peak at 249.3 vs 248.9 Pa. As the fire decays, the compartment falls back through the 200 Pa fan cutoff and the supply and return fans recover asymmetrically, so both dip briefly — NRC to 38 Pa at 1730 s, FRI3D to 59 Pa at 1770 s — before settling at 233 Pa.
Cable-tray targets
Tray target surface temperature at the three tray elevations
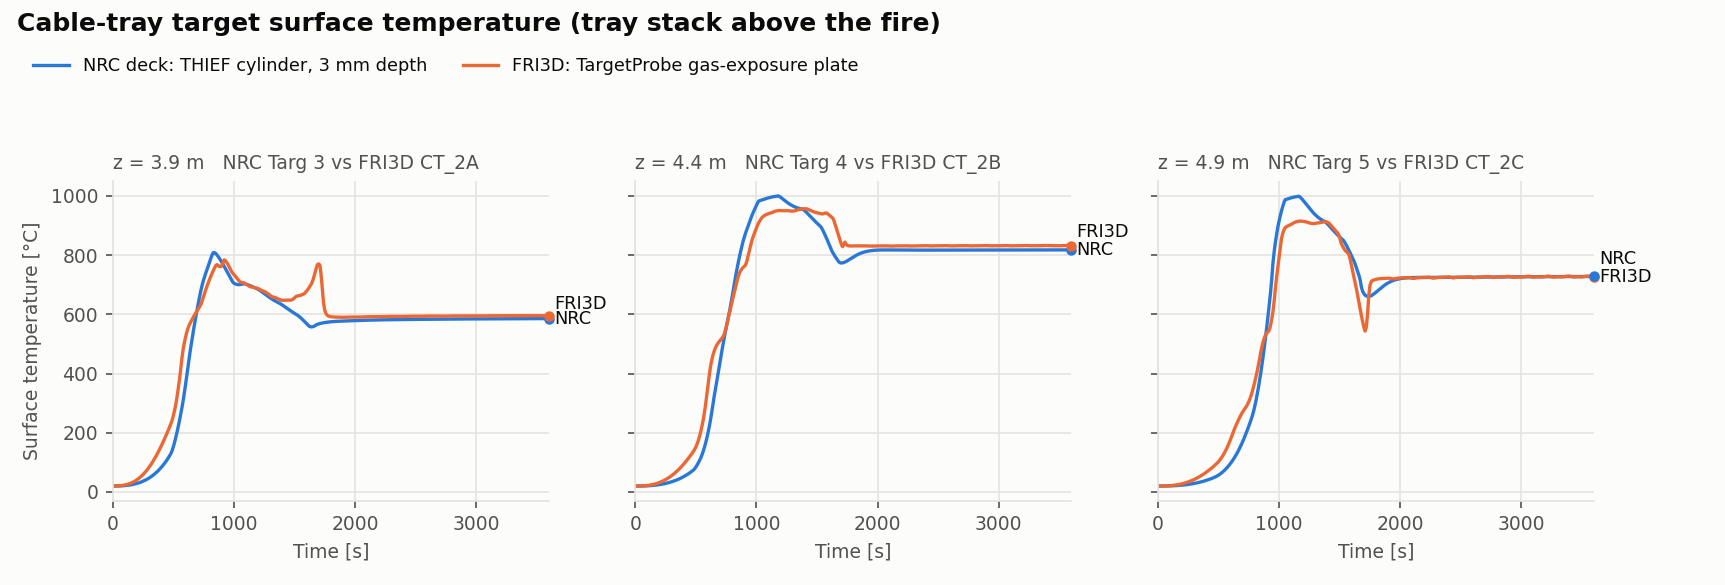
After the peak the FRI3D targets track NRC's at all three elevations and settle within 14 °C of them (596 / 832 / 727 vs 586 / 818 / 728 °C at 3600 s). The peaks are 3–9 % lower and the FRI3D targets heat earlier. Both come from the kind of target: NRC's are THIEF cable cylinders, FRI3D's are thin gas-exposure probes that respond faster and peak lower, and whose exposure FRI3D's cable failure models (THIEF and heat soak) use. Run with NRC's own tray fire, the FRI3D probes peak the same way, so the difference lies in the target, not the computed fire.
Matched-time comparison
FRI3D-generated deck / NRC baseline, over the 3600 s run:
| t (s) | HRR (kW) | Upper layer temp (°C) | Layer height (m) | Pressure (Pa) | Upper layer O₂ (%) |
|---|---|---|---|---|---|
| 300 | 81 / 81 | 23.1 / 23.1 | 5.45 / 5.45 | 229 / 229 | 20.4 / 20.4 |
| 600 | 426 / 441 | 32.8 / 33.3 | 4.59 / 4.55 | 243 / 243 | 20.1 / 20.1 |
| 900 | 960 / 1055 | 64.2 / 67.5 | 3.88 / 3.86 | 248 / 248 | 19.2 / 19.1 |
| 1200 | 1595 / 1599 | 99.8 / 100.9 | 3.52 / 3.51 | 243 / 243 | 17.6 / 17.5 |
| 1800 | 793 / 755 | 79.3 / 76.9 | 3.10 / 3.09 | 76 / 99 | 16.7 / 16.8 |
| 3600 | 717 / 678 | 70.8 / 68.4 | 3.03 / 3.01 | 233 / 233 | 17.3 / 17.5 |
Failure validation
NRC's Appendix B case defines failure for two kinds of item: the cables in the three trays, as THIEF targets failing when the cable interior passes 205 °C, and the cabinets next to the burning one, which NUREG-1934 concludes are not damaged. FRI3D's failures are compared against both. The tray (raceway) and burning-cabinet failures have no NRC counterpart; FRI3D's FDS result is shown for reference.
Cables
FRI3D evaluates the cables routed in the trays with its own THIEF implementation (NUREG/CR-6931 Vol. 3), driven by the gas temperature at the tray:
| Tray | FRI3D CFAST | NRC THIEF target | Difference | FRI3D FDS |
|---|---|---|---|---|
| 3.9 m | 537 s | 630 s | −93 s | 552 s |
| 4.4 m | 640 s | 700 s | −60 s | 742 s |
| 4.9 m | 835 s | 840 s | −5 s | 832 s |
- FRI3D's cables fail at or before NRC's at every tray, so the cable failure times are conservative against the reference.
- The difference comes from how the cable is exposed and where failure is read. NRC's CFAST cylinder target takes CFAST's full radiative and convective heat transfer, and is read 3 mm inside. FRI3D reads failure just inside the cable jacket, as THIEF prescribes.
Cable trays
| Tray | FRI3D CFAST | NRC | FRI3D FDS |
|---|---|---|---|
| 3.9 m | 506 s | not evaluated | 677 s |
| 4.4 m | 624 s | not evaluated | 815 s |
| 4.9 m | 818 s | not evaluated | 816 s |
- A tray fails by the heat-soak method: from the time history of the temperature and heat flux at its target, against the cable damage criteria.
- NRC evaluates the cables in the trays, not the trays themselves.
- The trays fail in stack order, each shortly before the cable it carries.
Cabinets
| Cabinet | FRI3D CFAST | NRC | FRI3D FDS |
|---|---|---|---|
| Burning cabinet | fails at 48 s | not evaluated (it is the fire) | fails at 232 s |
| Adjacent cabinets | not damaged; peaks 143 / 139 °C | not damaged; peak 137 °C | not damaged; surface peaks 95 / 85 °C |
The adjacent cabinets stay below the 205 °C damage threshold in every case, as NUREG-1934 concludes.
FLASH-CAT tray ignition
FRI3D runs CFAST twice. The first pass burns the cabinet alone, and FLASH-CAT reads from it when the lowest tray above the cabinet ignites, then grows the fire up and along the stack. The second pass adds the tray stack as its own fire, ignited at that time. Until the trays ignite, the two passes are identical, so the time found in the first pass holds in the second.
The lowest tray ignites when the cabinet's flames reach it: the first time the flame tip, the fire's base plus CFAST's flame height, is at or above the tray's bottom. This is the criterion NUREG-1934 itself applies to this scenario — its 480 s is the time the flames reached the lowest tray in a cabinet-only CFAST run. If the flames never reach the tray, FRI3D falls back on the tray's exposure:
| Criterion | First reached |
|---|---|
| Flame tip reaches the lowest tray (3.9 m) | 482 s |
| Fallback: incident heat flux above 6 kW/m² | 466 s |
| Fallback: five minutes after the gas at the tray passes 205 °C | 335 + 300 = 635 s |
The fallback takes the earlier of the two; here the flames reach the tray, so it is not used. The 205 °C and 6 kW/m² values are the NUREG/CR-6850 thresholds for thermoplastic cable, and the five minutes are FLASH-CAT's exposure time (NUREG/CR-7010). The trays above follow FLASH-CAT's timing sequence: 4, 3 and 2 minutes after the tray below, then 1 minute for every further tray. Here they ignite at 722 s and 902 s, against NRC's 720 s and 900 s.
FRI3D writes the stack as one fire whose heat release is the sum of its burning trays, like NRC's deck. Its area is that of the widest burning tray level, since the trays sit on top of each other.
Conclusion
The FRI3D-generated CFAST deck reproduces the NRC NUREG-1934 Appendix B switchgear baseline within 1 % on peak heat release rate, upper layer temperature rise, layer height, upper layer oxygen and pressure, with the tray ignition time (482 vs 480 s) and the secondary cable-tray fire computed by FRI3D's FLASH-CAT implementation from generic library data rather than prescribed. Tray target peaks are within 9 %, the difference traced to the kind of target rather than the computed fire, and the cables in the trays fail at or before the NRC reference.
Reference
- NUREG-1934 / EPRI 1023259, Nuclear Power Plant Fire Modeling Analysis Guidelines, Appendix B: Cabinet Fire in Switchgear Room.
- NUREG/CR-7010 Vol. 1, Cable Heat Release, Ignition, and Spread in Tray Installations During Fire (CHRISTIFIRE) — FLASH-CAT method.
- NUREG/CR-6850 / EPRI 1011989, Fire PRA Methodology for Nuclear Power Facilities — cable damage thresholds.
- NUREG/CR-6931 Vol. 3, Cable Response to Live Fire (CAROLFIRE): Thermally-Induced Electrical Failure (THIEF) Model — cable failure.
- NUREG-1824 / EPRI 1011999, Verification and Validation of Selected Fire Models for Nuclear Power Plant Applications (CFAST volume).